In 2012 Smartphone Users Spent US$ 8 billion for Paid Apps in the Top 5 App Platforms
The number of new apps in stores exceeds the demand side. This lowers the revenue and may, in effect, lead to a similar development as on the internet where paid content (paid apps) is not anymore a profitable business model.
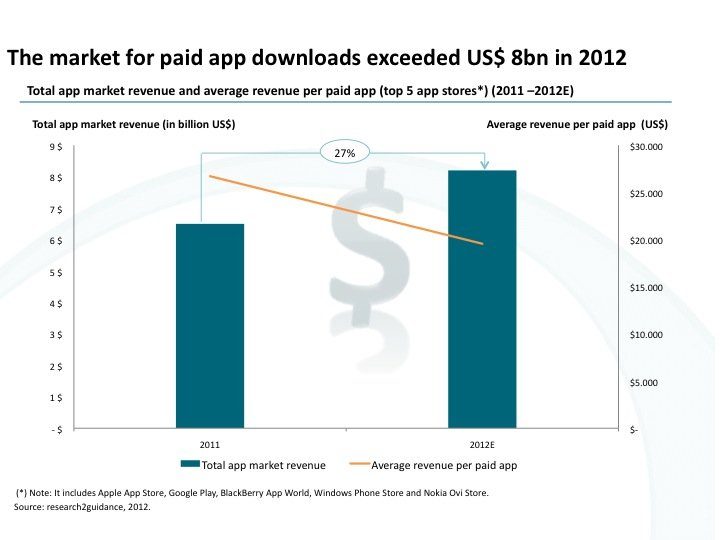
The market for paid application downloads has reached US$ 8 billion in 2012 in the top 5 app platforms. This represents an increase of 27% compared to 2011 figures (see chart below).
In the meantime, average revenue for paid applications has decreased from US$ 26,720 in 2011 to US$ 19,560 in 2012.
Despite the global slowdown of the economy the demand for paid mobile applications is growing at an impressive speed. The main driver is still the growing number of smartphone users with pre-installed app stores. The majority of paid downloads are being generated by 5 app stores: Apple App Store, Google Play, BlackBerry App World, Nokia Ovi Store and Windows Phone Store.
These finding are part of our new report “Smartphone Application Market Monitor” 8th edition.
This growing demand in turn gives rise to a surge in applications developed. Owing to this, there are now so many applications available that supply even exceeds demand. As a result, the average revenue of paid applications generated in 2012 is 27% lower than in 2011. Such a decrease is in line with previous years and could eventually lead to a development where paid apps are no longer profitable. This might lead to a similar situation as the internet one where, in general, paid content has proved to be not anymore a lucrative business model.
There are significant differences in the average revenue earned per application between the top 5 app stores. The trend nevertheless remains the same for all platforms.
As a consequence more and more application publishers build their applications around other revenue models, which include:
1. in-app advertisements, e.g. banners
2. in-app purchases, e.g. allowing the user to reach a new level in a game
3. mCommerce, e.g. selling pizza via app
4. bundles with hardware or services, e.g. a free application bundled to a priced sensor to track health parameters
5. efficiency gains for internal and external processes, e.g. a service technician app
6. cost reduction, e.g. personal health record app, which allows patients and doctors to record medical treatments in order to prevent double-examination costs
The shift in revenue models also means that mobile applications will resemble more and more traditional applications that we know from the enterprise application market with common business models.
For more information, please have a look at the 8th edition of the “Smartphone Application Market Monitor”.
The report comes in 3 versions:
PDF Report and PPT File (bundle of both files: PDF and PPT)
PDF Report (52 Pages, explanatory text)
PPT File (49 Pages, drag-and-drop slides into your presentations)
We would like to know which business model, in your opinion, will become the dominant model for the mobile application market. Please comment.


